My pandemic silver lining
Experiencing the transformational quality of a single good habit
 Illustration: Caitlin Keegan
I count my blessings to have been relatively unscathed by the pandemic in more ways than one. Here, I take stock of how the rearrangement of my day-to-day routine led to unexpected developments in my physical well-being.
As a kid, I actively participated in sports. I started playing badminton at seven and was on my school’s team for more than half a decade. Then came a long hiatus as my priorities shifted to academics and getting into the university of my choice. Over time, I got more sluggish, and fitness was not a priority.
Sheltering-in-place and working from home over the past year and a half, however, provided me the opportunity to rethink my entire approach to fitness. I sought physical therapy, joined a gym for the first time, signed up for personal training sessions, and participated in my first 5k.
Mobility 101
After the initial, destabilizing shock of the pandemic wore off, I realized I had untapped reserves of time and energy to pay attention to and address what was bothering me; the way my ankle would protest whenever I sat on them, or why I resolutely avoided burpees and mountain climbers (weak lower back).
The “gift” of these aches and pains was that it sent me back to basics to master the fundamentals. My physical therapist prescribed me a cocktail of movements -– run-of-the-mill moves like balancing on one foot, holding a plank, and maintaining proper posture – to undo the damage I had accumulated from years of poor mobility. My “homework” was to repeat what I had learned during therapy at home every day. I felt like a bona fide beginner, taking stumble-ridden baby steps day after day till my body eventually learned new movement patterns and ranges of motion.
To sustain progress, I had to commit to practicing good habits throughout the day and not just during a workout. After all, you “can’t offset 10+ hours of sitting every day with a 1-hour workout”.1
This involved getting into various postures and positions, sometimes against the wall, sometimes on a chair but mostly on my yoga mat on the floor. I leaned into the discomfort and learned to “embrace the suck” of holding a pose or repeating a motion that was not particularly enjoyable, like sitting 90-90.
On a positive note, performing these micro-movements throughout the day helped break up the monotony of prolonged sessions of desk work. Taking multiple breaks to engage in some physical activity was something I was aware of but had all too conveniently assumed that a quick and intense workout a day would suffice to keep potential ailments at bay.
Foray into #GymLife
When I felt more confident in my body, I decided to take on a fitness challenge. Up to that point, I had a joyless, repetitive meat-and-potatoes workout routine. High-intensity interval training (HIIT) workouts were my go-to because I was myopically focused on maximizing caloric output in as little time as possible. It was not enough. I needed something straightforward and doable to commit to like training for a 5k.

Eager to stay true to my new training regime (above), I’d dutifully climb the treadmill like a hamster on its wheel, week after week. Running regularly made me aware of how much the past decade of desk work had stiffened my hip flexors and hamstrings. This was a weakness I could address now while at the gym by adding specific strength-building moves to a given workout. After years of perfunctory HIIT sessions, it was both rewarding and humbling to challenge my body in new ways.
Besides a well-curated music playlist, another accessory essential to my fitness journey was an activity tracker. Wearing a watch that quantified my exertions appealed to my data-driven sensibilities. I looked forward to learning how many steps I had taken in a day or monitoring my heart rate during a workout. More importantly, I could measure and evaluate my progress over time (more on that below). A fitness tracker also provided objective contrast to my own subjective perceptions of much effort I was putting in, which could vary wildly depending on how motivated I felt that day, the quality of sleep I got the night before etc.
Incidental Exercise
Only recently did I learn about the concept of “incidental exercise” which simply means being active and on the go, engaging the body in some form of movement. When sheltering-at-home first began, the urge to simply wallow in stillness and lethargy was overwhelming.

At the same time, being restricted to one physical location meant I needed ways to channel and expend my restlessness. One such way that emerged organically was going on long walks with my dog. I cannot remember the last time I had simply meandered. Quite literally, I found myself “carried on foot by random currents from one block to another”2. Seeking out paths with less foot traffic, I explored nooks and crannies of the neighborhood I’d never passed through before. Moreover, restricted access to public transportation provided the initial impetus to accomplish almost all my chores and errands by foot. Having this new routine kept me grounded and lessened the claustrophobia of quarantine.
Charting progress
My pandemic silver lining was experiencing the transformational quality of a single good habit; my experiences over the past year and a half months broke the mold of how I approached physical fitness.
The biggest takeaway for me: movement could happen across a range of venues and throughout the day, not just during a sweaty workout session. It could take the form of deep cleaning your home, taking long, leisurely walks, regularly preparing homecooked meals etc. An adage I kept returning to was “motion is lotion”. Any movement however small and humble was a step in the right direction.
There were many days I did not want to show up, for various reasons - the collective burnout, mental exhaustion, or just plain muscle fatigue. I did not always look forward to putting on my workout attire, strapping on my fitness tracker, and searching for the right playlist, so on days that I honored my body’s need for rest, I’d recovery actively by going on longer walks or tackling more chores. This kept stasis at bay and kept me from breaking the chain of good habits.
To keep myself committed to the process, I decided to track my progress across three dimensions of activity – mobility drills, workouts, and incidental exercise.
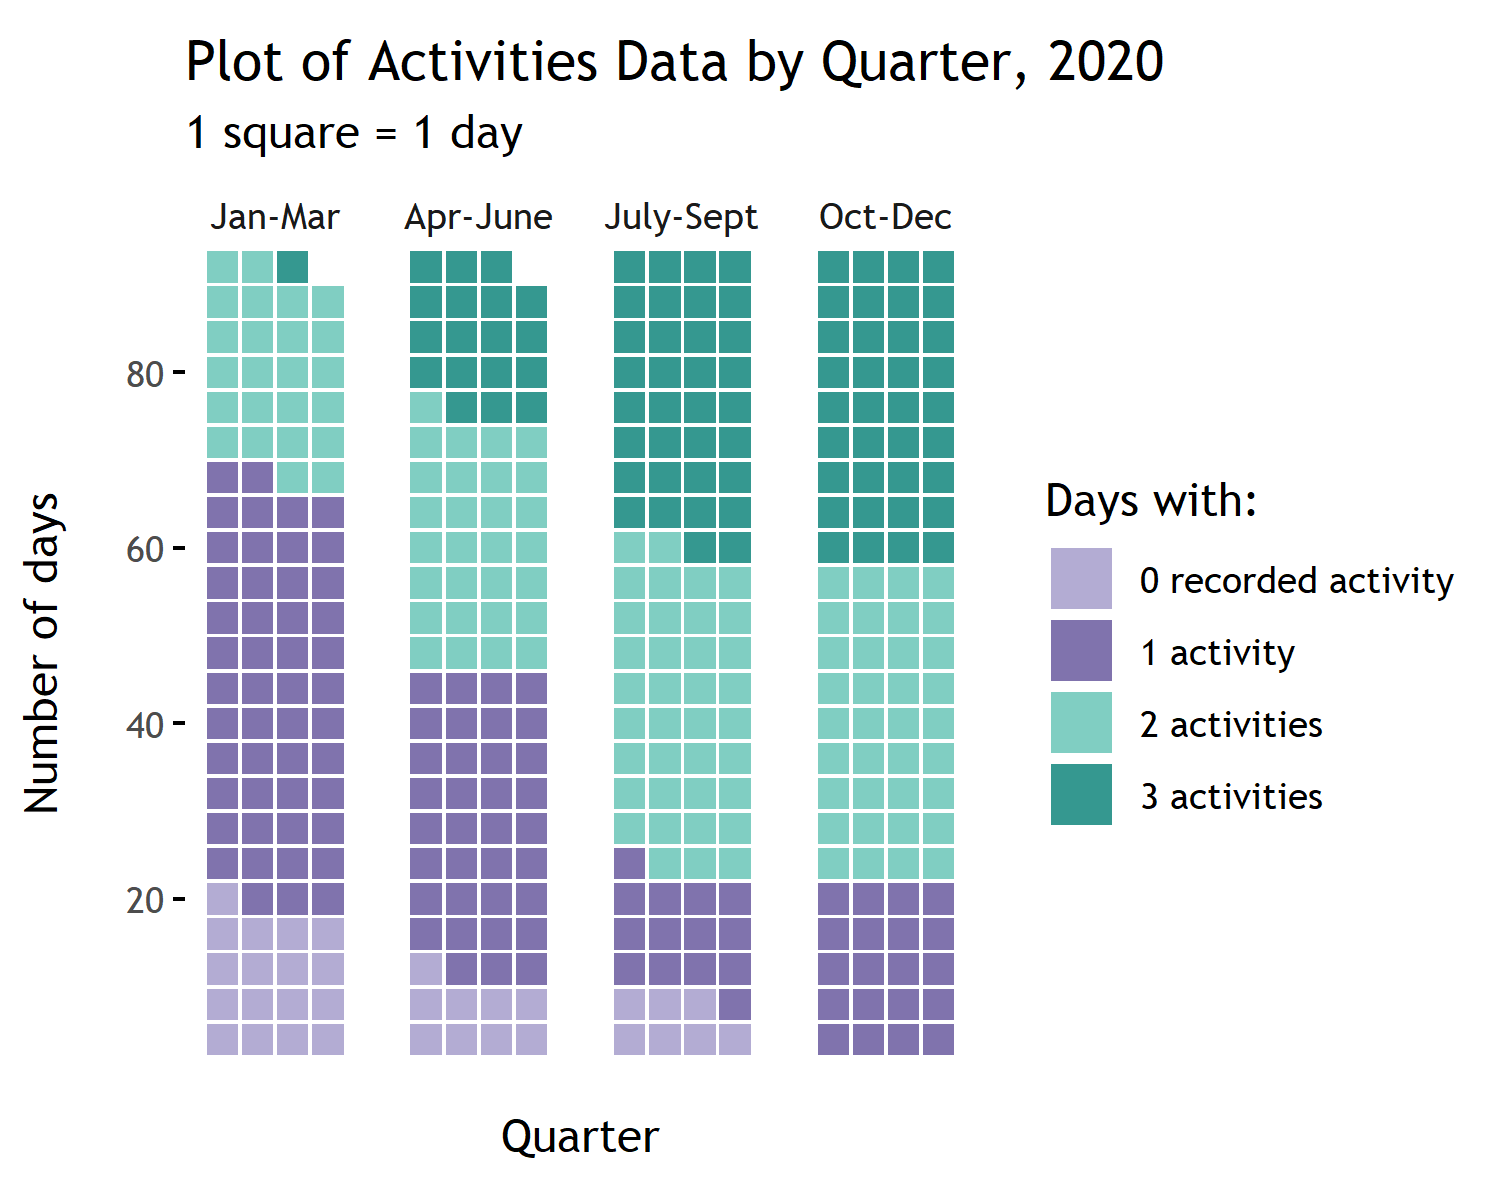
A dark green tile in quarter one meant that there was only one day in that time period where I had engaged in all three activities. Over time, the number of days I was not very active (i.e. 0-1 recorded activities) demonstrably decreased, with the final quarter being when I was most active. I channeled this momentum and it became my new normal in 2021.
Code to produce mosaic plot (data graphic) 3 4
library(tidyverse)
library(lubridate)
library(hrbrthemes)
library(waffle)
library(ggplot2)
library(dplyr)
# CREATE TIME DATA FRAME
start_date <- as.Date("2020-01-01")
end_date <- as.Date("2020-12-31")
time <- tibble(date = seq(start_date, end_date, by = "1 day"))
time <- time %>%
mutate(
week = format(date, "%W"),
day = format(date, "%A"),
day_n = format(date, "%u"),
month = format(date, "%B"),
month_n = format(date, "%m"),
quarter = quarter(date))# DATA PREVIEW
head(time)## # A tibble: 6 x 7
## date week day day_n month month_n quarter
## <date> <chr> <chr> <chr> <chr> <chr> <int>
## 1 2020-01-01 00 Wednesday 3 January 01 1
## 2 2020-01-02 00 Thursday 4 January 01 1
## 3 2020-01-03 00 Friday 5 January 01 1
## 4 2020-01-04 00 Saturday 6 January 01 1
## 5 2020-01-05 00 Sunday 7 January 01 1
## 6 2020-01-06 01 Monday 1 January 01 1# IMPORT ACTIVITIES DATA
activities <- read.csv("C:/Users/gmoreno/Downloads/activities_df.csv") #366 obs 6 vars # DATA PREVIEW
head(activities)## date workout_or_not mat_pt_mobility_session incidental_exercise
## 1 1/1/2020 1 0 1
## 2 1/2/2020 1 0 1
## 3 1/3/2020 1 0 DNT
## 4 1/4/2020 1 0 1
## 5 1/5/2020 0 0 1
## 6 1/6/2020 0 0 1# MISSING DATA
round((sum(activities$workout_or_not == "DNT")/nrow(activities))*100, 2) #2.7%
round((sum(activities$mat_pt_mobility_session == "DNT")/nrow(activities))*100, 2) #5.5%
round((sum(activities$incidental_exercise == "DNT")/nrow(activities))*100, 2) #14.5%
# REPLACE "DID NOT TRACK" WITH 0 (see footnote at the end)
activities <- activities %>%
mutate(
workout_or_not = replace(workout_or_not, workout_or_not == "DNT", 0),
mat_pt_mobility_session = replace(mat_pt_mobility_session, mat_pt_mobility_session == "DNT", 0),
incidental_exercise = replace(incidental_exercise, incidental_exercise == "DNT", 0)) %>%
mutate(
workout_or_not = as.numeric(workout_or_not),
mat_pt_mobility_session = as.numeric(mat_pt_mobility_session),
incidental_exercise = as.numeric(incidental_exercise))
# CONVERT DATE
activities$date <- as.Date(activities$date ,format = "%m/%d/%Y")
# JOIN ACTIVITIES DATA TO TIME DATA FRAME
df <- left_join(time, activities, by = c("date")) #366 obs 12 vars
# COMPUTE SUM OF ACTIVITIES FOR EACH DAY
df <- df %>%
mutate(
sum_workout_mobility = workout_or_not + mat_pt_mobility_session,
sum_workout_incidental = workout_or_not + incidental_exercise,
sum_all = workout_or_not + mat_pt_mobility_session + incidental_exercise)
# CONVERT TO FACTOR WITH LABELS
df <- df %>%
mutate(
quarter = factor(quarter,
levels=c(1,2,3,4),
labels=c("Jan-Mar", "Apr-June", "July-Sept", "Oct-Dec")),
sum_all = factor(sum_all,
levels = c(0,1,2,3),
labels = c("0 recorded activity", "1 activity", "2 activities", "3 activities")))
# COLLAPSE SUM OF ACTIVITIES BY QUARTER
all_quarters <- df %>% count(quarter, sum_all)
# CREATE DATA GRAPHIC!
ggplot(all_quarters, aes(fill = sum_all, values = n)) +
geom_waffle(color = "white", size = .25, n_rows = 4, flip = TRUE, height = 0.95, width = 0.95) +
scale_fill_manual(values = c("#B3ACD3", "#8073AD", "#80CEC2", "#359890")) +
facet_wrap(~quarter, nrow = 1, strip.position = "top") +
scale_x_discrete() +
scale_y_continuous(labels = function(x) x * 4, # make this multiplier the same as n_rows
expand = c(0,0)) +
coord_equal() +
labs(title = "Mosaic Plot of Activities Data by Quarter, 2020", subtitle = "1 square = 1 day") +
xlab("\nQuarter") + ylab("Number of days\n") +
theme(axis.title.y = element_text(margin = margin(t=2, r=0, b=2, l=0))) +
theme(axis.title.x = element_text(margin = margin(t=4, r=0, b=4, l=0))) +
theme_minimal(base_family = "Trebuchet MS") +
theme(panel.grid = element_blank(), axis.ticks.y = element_line()) +
guides(fill = guide_legend(title = "Days with:")) +
theme(strip.text.x = element_text(hjust = 0.5)) Thanks for reading! If you have thoughts or comments on this article, feel free to share them with me via email or Twitter
Squat University [@SquatUniversity]. Twitter, 16 Feb 2021, https://twitter.com/SquatUniversity/status/1361782531557851141↩︎
Trebay, Guy. “A Walker in the City.” 20 July, 2020, https://docs.google.com/document/d/1Loq9kKsm3EysWDt7AqZseaedoB-28-lRx6n9O4ml2xU/edit↩︎
There were days I was not able to track whether or not I have completed an activity so missing data is converted to 0, absence of activity to keep estimates on the conservative side↩︎
In thinking about the kind of visualization that would capture the entire year, I also considered the line graph, for instance, which would have depicted day-to-day variation better. The mosaic plot however conveys the main takeaway much more effectively.↩︎
Gina Moreno
Senior Research Analyst
My research interests include criminal justice program evaluation, drug policy reform, and quantitative research methods